MA_Predict
The Problem
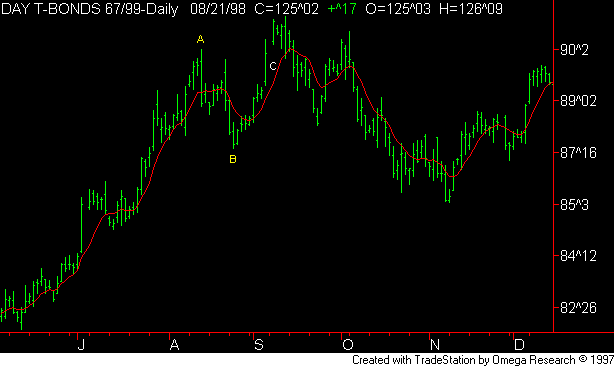
Technical Indicators all share one common failing that has often served to seriously curb their usefulness when trying to determine the future direction of prices: they all suffer from lag. Since indicators are really nothing more than mathematical expressions of past price history, it is easy to see why they should follow a little behind the market. Perhaps the most well known indicator is the moving average, where prices are summed up over a given period and then divided by the length of that period. Moving averages give a smooth picture of price action, but are hampered by the fact that they tend to lag so far behind price. Below is a chart of Treasury Bonds with a ten day weighted moving average applied to it.

You can see that the moving average does a good job of smoothing price action. But take a look at the turning points A and B as marked on the chart. Notice that the moving average peaks associated with the same turning points are both a little late. Also note the big space between price and the moving average at C, where the moving average had trouble tracking a quick rally. You wouldn't trade using a week old newspaper, so why should you trade with an indicator that gives last week's signals?
The Solution
It is with this problem in mind that we set out to create MA_Predict. Although the name implies that we are interested in forecasting future values of something, the true power of this indicator lies in its ability to reduce lag. It will take any technical indicator you choose to give it and will apply our proprietary self-optimizing technology to try and shift the indicator back in line with price.
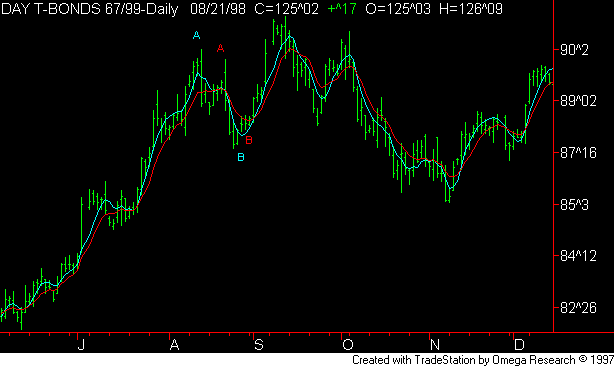
Let's look at Treasury Bonds again. This time, we will apply the same 10 day weighted average to the chart but will also include MA_Predict working to make the weighted average more adaptive.

The red line is the original version of the moving average while the blue line is MA_Predict. You can see that the blue line tracks prices much more closely than the red line, creating a filter that is more timely and accurate than what we started with. The time delay between price and the moving average has been reduced at A and B and the subsequent rally was also tracked more closely. The amazing thing is that this reduction in lag was accomplished with only the moving average as the input and no use of complicated artificial intelligence programs such as neural nets.
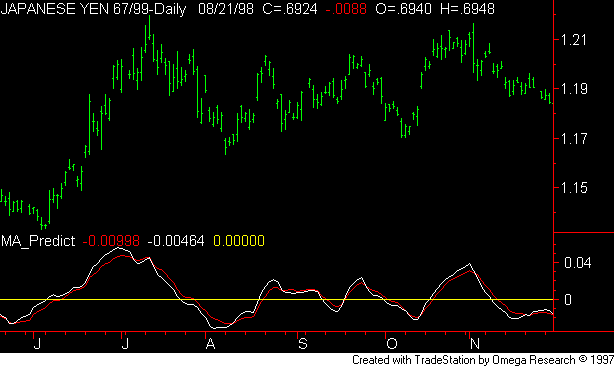
MA_Predict can be used to reduce the lag in any indicator. Below we have applied it to the 15 day smoothed momentum of the Japanese Yen.

The red line is our momentum curve and the white line is MA_Predict. You can see that MA_Predict leads momentum both to the upside and to the downside. Also notice how MA_Predict crossed the yellow zero line before momentum did in all instances. This speaks volumes for its ability to reduce lag.
Another Leap Forward!
After creating and working with MA_Predict for awhile, we began to realize the power of this approach and began construction on an improved version that would be able to not only reduce lag, but call future turning points in the indicator in question. We have recently completed construction on the deluxe version, and have found it to be an invaluable tool in building many of our proprietary systems.
MA_PredictDELUXE will take up to three inputs specified by the user and will use them to forecast future values of a fourth indicator. It uses its own error to adjust its forecasts, and continuously retrains itself to adapt to recent market behavior. This is about as close as one can get to programming artificial intelligence using only Omega Research's EasyLanguage.
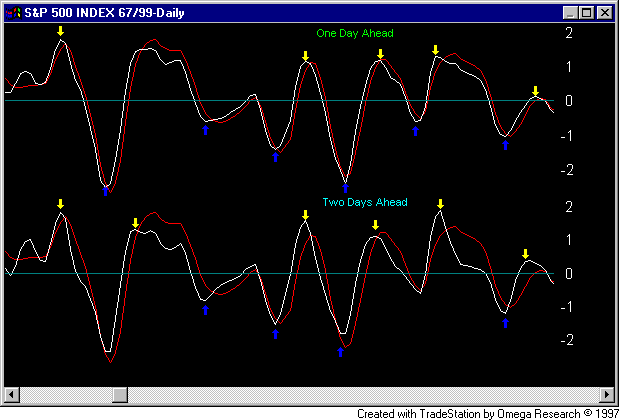
Below is an example of MA_PredictDELUXE at work on momentum. The prediction tool used a lookback period of 50 bars and retrained itself every 5 bars.

The top half of the screen shot shows a one day prediction of an 8 period MA_Momentum curve. The red line is the original indicator while the white line is MA_PredictDELUXE at work. Note that the white prediction line crosses the zero line ahead of the original in all instances and leads the original both to the upside and to the downside.
The bottom half of the screen shows a two day prediction of the same momentum curve. Notice that the white line leads the original red line but does so more aggressively than in the one day prediction scenario. Arrows have been placed on the chart at selected places to show when MA_PredictDELUXE formed a turning point before the original indicator did. The fact that turning points themselves have been forecast testifies strongly for MA_Predict's ability to create leading indicators.
We are currently offering MA_Predict (both versions included) for only $275, a small price to pay to attack the most glaring weakness in all of technical analysis. Like our other indicator products, user functions are included so you can build your own custom systems using these tools. Improve your entire toolbox at one swoop. Please click here for more details.