Trading Tutorial #2 - The Inversion Cycle
This tutorial is meant to show you the importance of keeping track of the intersection points between the inverted and normal forecasts. This is a more advanced technique, and should be implemented after you are already familiar with using the forecast with the method described in tutorial 1.
After you have been using the forecasts for a week or so, you will become aware that the market will suddenly switch from following one forecast to following another. This is called an inversion, and can be a great cause of confusion at the beginning. At first, it may appear that inversions occur with out warning - or maybe only after you have taken a position. The truth is that inversions tend to occur when the positive and negative forces moving the forecast are equally balanced. This fits in very well with chaos theory, for those of you are familiar with it. Imagine balancing a ball on a thin wire in the air. Now try to predict which side of the wire the ball will fall to. Can you really predict? Sometimes the ball will fall right and sometimes it will fall left. This kind of thing is the essence of chaos theory - two solutions to a given problem.
The same kind of thing happens with our forecast. The market moves along in one domain of behavior, following either the inverted or normal forecast. Eventually the forecast will reach the balancing point, and a decision will have to be made whether to continue with the current forecast or to invert. The key to being able to anticipate these inversions is to know where the balancing level is. You can do this by locating the midpoint of the current day's forecast. Conveniently for us, this gravity center is located at the intersection points between the normal and inverted forecasts.
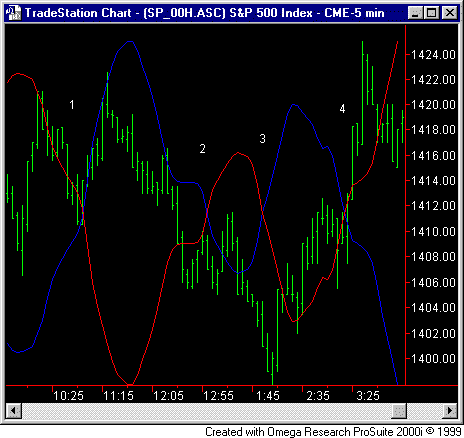
Below is a chart that should make things clearer:

The blue line is the normal forecast and the red line is the inverted forecast. The intersection points highlight the balancing level, and each intersection has been marked with a number. Notice what happened this day - the market moved down the inverted forecast to point 1, a balancing point, and flipped to other end of the wire, choosing to follow the blue line. The market followed the normal blue forecast until point 2, another balancing level. Price then reverted back to the inverted forecast and did not invert again that day.
Notice how using the forecast in this way explained nearly everything that happened in this day. If we had known which points would translate to inversions, we could have really cleaned up. Unfortunately, we never know which way the market will go at these levels, only that a choice has to be made.
So how powerful is this approach? We went back and studied around 200 inversions and found an interesting statistic: 71% of all inversions can be explained with the intersection method. 71% is a great result, and gives you another tool to put the odds in your favor when placing a trade. Here is an example of how to do that.

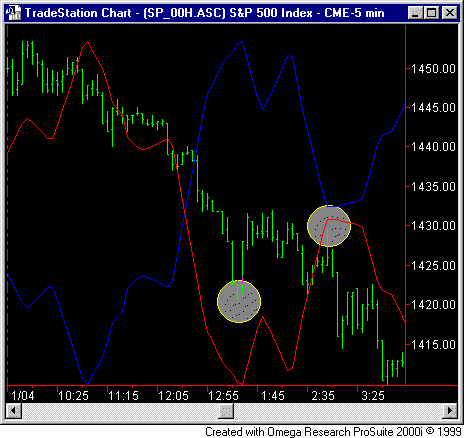
This day price followed the inverted forecast until the intersection point at 12:30, then continued down to the first gray ellipse and we had a bounce. If you were sitting here with this chart in hand, what would you be able to say about the current situation? First note that there are no more intersections this day. This will eliminate 71% of all inversions, so ideally we should follow the inverted forecast for the rest of the day. There are still the 29% of inversions to trip us up, so we can't go totally on autopilot, but the coast is clear so to speak. We can confidently answer these two very important questions:
1) Should we have a rally now?
2) If so, how long will this rally last?
The answers were "Yes, we should have a rally" and "Until 2:55." It turned out to be a pretty lame rally, but it was a rally none the less. This tells you the coming down move should be bigger than anticipated. This rally did last until 2:55, and then we had our decline as our forecast predicted.
Hopefully, the following two examples made it clear why it is important to track the intersection points. If you know when to expect inversions, you will be that much more able to take advantage of trading opportunities that arise near and away from these points. The QuickView program that comes with your subscription has the ability to plot both the inverted and normal forecasts on the same chart, so finding the intersection times is a snap.
One quick warning. Be careful when using other charting programs to do this as automatic scaling can produce incorrect intersection times! That would give a false balance level and you can no longer rely on the 71% statistic to help you. Make sure your charting program matches up with QuickView before you start any analysis.